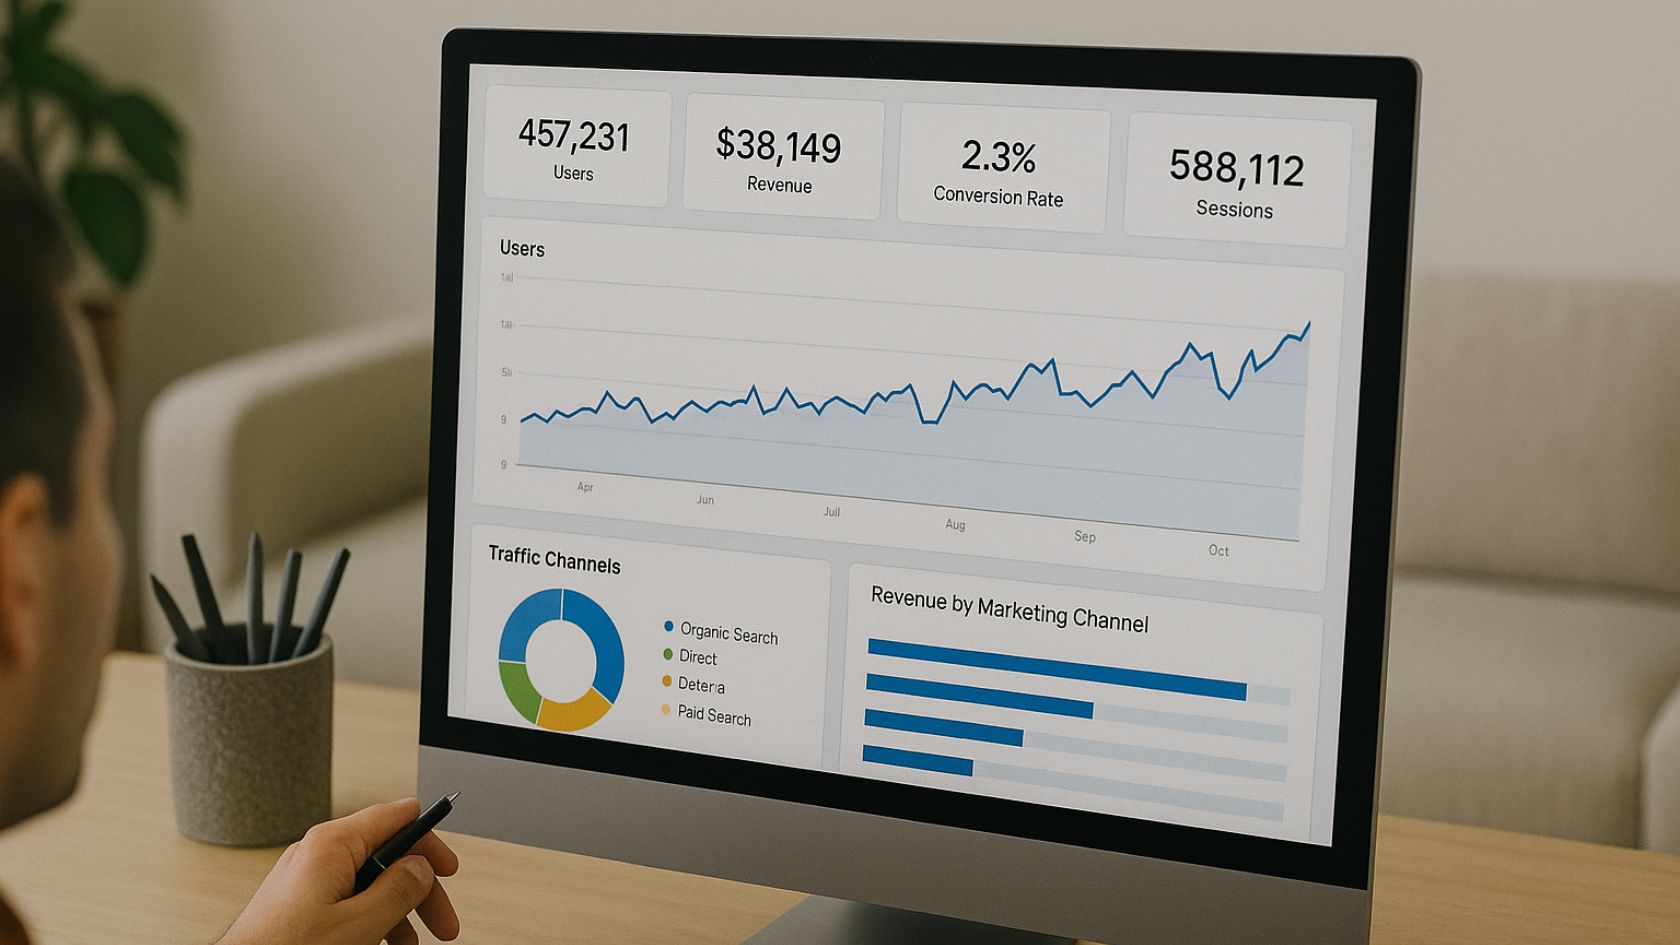
Mastering Website Analytics: How to Turn Data into Growth

Website analytics is the foundation of data‑driven growth for any modern site, helping you understand where visitors come from, how they behave, and which experiences convert attention into revenue.
If you’re just getting started, the most important step is picking a lean, reliable tech stack and defining what success looks like. A practical starting point is to select a primary analytics platform, a visualization layer for dashboards, and a way to track experiments. As you evaluate options, this overview of
tools for website analytics
can help you compare capabilities and choose components that fit your traffic level, team skills, and compliance needs.
Key concepts that make website analytics useful
Before you create reports, get comfortable with the core concepts. These terms anchor your understanding and make insights transferable across tools:
- Users vs. Sessions: Users are distinct people (or devices); sessions are visit instances. One user can have many sessions.
- Pageviews vs. Events: Pageviews record page loads; events capture specific actions (clicks, form submits, video plays).
- Engagement Rate / Bounce Rate: Engagement rate approximates meaningful interaction; bounce rate is the inverse.
- Acquisition Channels: Groupings like Organic, Paid, Direct, Referral, Social, and Email that bring traffic to you.
- Goals and Conversions: Business outcomes you care about (sign‑ups, purchases, downloads) and how often they occur.
- Attribution: Rules that assign credit for conversions to touchpoints (e.g., last‑click, first‑click, data‑driven).
- UTM Parameters: Tracking tags you append to links (e.g., utm_source, utm_medium, utm_campaign) to measure performance.
From raw data to decisions
The real value of website analytics appears when you move from counting activity to making decisions. Start with a single, high‑impact question: “Which content and campaigns create the most profitable growth?” Answering this pushes you beyond vanity metrics and into measurable outcomes. For inspiration, even niche segments—such as advertisers in specific verticals—rely on careful attribution and funnel analysis to determine which partnerships and creatives bring revenue. For example, marketers evaluating opportunities like
wedding affiliate programs
often segment by audience intent, device, and landing page experience to find the combinations that actually convert.
Build a simple measurement plan
A measurement plan prevents overwhelm and ensures that what you track aligns with business outcomes. Here’s a lightweight template you can adopt today:
- Define objectives: e.g., grow qualified leads, increase online sales, improve content engagement.
- Map KPIs to each objective: lead submissions, revenue, average order value, trial‑to‑paid rate, newsletter sign‑ups.
- Specify events: form_submit, add_to_cart, checkout_start, purchase, newsletter_subscribe, video_complete.
- Choose targets: e.g., +25% organic traffic in 90 days, +10% conversion rate, +15% email CTR.
- Assign owners and cadence: who builds dashboards, who reviews weekly, who decides experiments.
Instrument clean, trustworthy data
Trustworthy analysis starts with clean instrumentation. Implement a tag manager to centralize code snippets, maintain a naming convention for events and parameters, and verify every goal with test traffic before launch. Consider server‑side tagging for performance, privacy, and ad‑block resilience. Always document your schema—what each event means, where it fires, and how it’s validated—so that new teammates can maintain consistency.
Make sense of behavior with segmentation
Segmentation turns averages into insight. Slice results by channel, campaign, device, geography, returning vs. new users, and content category. A common pattern: mobile users convert less on complex forms; shortening fields and enabling wallet pay can lift mobile revenue quickly. Another: returning users often drive higher lifetime value, so re‑engagement email flows and smart remarketing can be more profitable than broad prospecting.
Analyze funnels and user journeys
Funnels reveal where intent decays. Start with a simple path (landing page → product page → cart → checkout) and measure drop‑off at each step. Pair this with qualitative inputs like session replays and user surveys to pinpoint friction—unclear pricing, slow page loads, or form errors. Then prioritize fixes by expected impact and effort. Small wins compound quickly when measured properly.
Turn insights into experiments
Website analytics should power a continuous testing loop. Draft a hypothesis (e.g., “Reducing steps in checkout will increase purchase rate by 8%”), design an A/B test, estimate sample size, and pre‑define success criteria before you launch. Keep tests mutually exclusive when possible; overlapping experiments can contaminate results. Archive learnings so that new teams avoid rerunning old tests and can build on prior knowledge.
Dashboards that drive action
Reporting is only useful if it changes decisions. Build lightweight dashboards that highlight trends, not just snapshots. A weekly growth dashboard might include traffic by channel, conversion rate by landing page, top content, top search queries, revenue by device, and a short list of anomalies (e.g., “Direct traffic spiked 40% on Friday—likely untagged email”). Add a section for “decisions made this week” to reinforce action bias.
Common pitfalls (and how to avoid them)
- Vanity metrics: Pageviews and followers feel good but rarely move the business alone. Tie them to conversions.
- Dirty data: Bot traffic, internal IPs, and duplicate events can distort results. Filter, deduplicate, and QA regularly.
- Attribution confusion: Different models give different answers. Pick one model for trend tracking and document it.
- Analysis paralysis: Too many metrics cause indecision. Limit KPIs, set targets, and commit to an experiment cadence.
- Slow pages: Performance issues tank conversion. Monitor Core Web Vitals and fix regressions promptly.
Essential website analytics KPIs and quick formulas
- Conversion Rate (CR): conversions ÷ sessions × 100
- Click‑Through Rate (CTR): clicks ÷ impressions × 100
- Bounce Rate: bounces ÷ sessions × 100 (or converse of engagement rate)
- Average Order Value (AOV): revenue ÷ orders
- Customer Acquisition Cost (CAC): total marketing spend ÷ new customers
- Return on Ad Spend (ROAS): revenue attributable to ads ÷ ad spend
- Lifetime Value (LTV): average revenue per user × gross margin × retention period
Choosing a stack that scales with you
Early on, prioritize simplicity and speed. As you scale, you can layer on deeper capabilities like warehouse‑native analytics or server‑side tracking. The right choice is the one your team will actually use weekly. Document your playbooks, keep dashboards tidy, and maintain a backlog of questions you can’t yet answer—then improve instrumentation to close those gaps.
SEO + content insights from website analytics
Your analytics data is a goldmine for SEO and content strategy. Track which pages earn the most organic entrances, which queries trigger impressions but low clicks, and where users stall. Use these insights to refresh titles and meta descriptions, strengthen internal links, and build content clusters. When a post ranks but underperforms on engagement, study scroll depth and replace weak sections with clearer examples, visuals, or FAQs.
Privacy, consent, and compliance
Respecting privacy builds trust and protects your data program. Implement a clear consent experience, honor user choices, and minimize data collection to what’s necessary for your KPIs. Regularly review vendor settings, retention policies, and regional rules. Privacy‑conscious practices also improve data quality by reducing noise and aligning expectations across your organization.
Quick start checklist
- Write a one‑page measurement plan with objectives, KPIs, and target thresholds.
- Instrument 5–10 well‑named events that map directly to conversion moments.
- Set up UTM conventions and enforce them via templates or link builders.
- Build a weekly dashboard that highlights changes, anomalies, and decisions.
- Launch one meaningful A/B test per month and archive learnings.
Conclusion
Website analytics is most powerful when it’s simple, trustworthy, and relentlessly action‑oriented. Start with a clear measurement plan, instrument only what you need, and focus your reporting on trends that guide decisions. Over time, layer in segmentation, funnel analysis, and experimentation to compound results. For competitive context, many marketers also consult ad intelligence resources such as
Anstrex
to study creative angles and landing page patterns. Keep the loop tight: measure, learn, and ship improvements—and let the data show you where to go next.